Accepted · 2026
Generative AI Surrogate Models for Pedestrian Density Heatmap Prediction: A Controlled Ablation of Backbone Architecture and Adversarial Training
A four-configuration study of backbone architecture and adversarial training for pedestrian density heatmap prediction from synthetic floor plans.
Contact: detthana.patt@outlook.com
Peer reviewed and accepted; awaiting publication.
Introduction
In the design of public buildings, pedestrian simulation is a critical evaluation tool for circulation efficiency, spatial performance, and evacuation safety, particularly in high-density typologies such as airports and transit stations. Conventional simulation relies on physics-based computation, most commonly the Social Force Model [1], which reproduces crowd dynamics with high fidelity but scales poorly with floor area and agent count, often requiring hours per run. This computational cost makes physics-based simulation impractical for the iterative, multi-alternative exploration typical of early-stage design.
Machine learning has increasingly been proposed as a substitute. Most existing work targets individual-level trajectory prediction from observational data such as Wi-Fi or CCTV traces, while comparatively little research predicts macroscopic outputs, evacuation time or density fields, directly from floor plan geometry. [2] systematically reviewed machine learning in pedestrian and evacuation dynamics (Scopus, 2022—2024), finding floor-plan-conditioned macroscopic prediction comparatively underexplored. [3] used a Vision Transformer to predict evacuation time and density heatmaps from floor plan images, establishing the viability of data-driven surrogates without exploiting room-connectivity structure. [4] combined pix2pix-generated congestion heatmaps with an XGBoost evacuation-time model and SHAP feature importance for fire-emergency egress evaluation. [5] proposed DiffEvac, a diffusion-based method for evacuation flow-accumulation prediction, improving on conditional-GAN baselines. [6] applied graph neural networks as early-design surrogates, though limited to energy outcomes. Across this body of work, evaluated architectures are typically singular, one generative model compared against a non-learned baseline, and none isolate the contribution of adversarial training from backbone architecture, the gap this study addresses.
An open question therefore remains: none of these studies isolates whether prediction accuracy is driven by backbone architecture, training objective, or their interaction. We hypothesize that both an adversarial discriminator and a ResNet-based backbone independently affect accuracy, and test this under identical dataset size and training epochs. Distinguishing between them matters practically: adversarial training is unstable and expensive to tune, so if backbone architecture dominates, simpler non-adversarial pipelines may suffice. As detailed in Section 3, our results support the backbone hypothesis more strongly and suggest that the two factors interact: adversarial training appears to help more when the backbone is weaker (U-Net), though this rests on a single run per configuration and should be read as suggestive rather than confirmed. Overall, backbone architecture appears to be the primary driver, with adversarial training offering a secondary, backbone-dependent benefit.
This study tests both hypotheses, and their interaction, using the four-configuration, -factorial design detailed in Section 2, distinguishing it from prior work that evaluates at most a single generative architecture against a non-learned baseline without isolating which design factor drives performance.
The objectives of this study are threefold: (1) compare the relative contribution of backbone architecture and adversarial training to prediction accuracy through the four-configuration ablation; (2) test whether the two factors interact, using two pairwise discriminator comparisons matched within each backbone family; and (3) characterize how accuracy varies with occupancy level and route length, to identify where each design choice matters most.
Methodology
Research Design Overview
This study is structured as a factorial of two backbone architectures and two training objectives, trained under identical data conditions and evaluated with a consistent metric set, as shown in Table 1. All four factorial cells are populated: a U-Net backbone trained without a discriminator (Plain U-Net), the same U-Net backbone trained with a discriminator (pix2pix), a ResNet-based backbone trained without a discriminator (ResNet-9), and a separately implemented ResNet-based backbone trained with a discriminator (pix2pixHD). This yields two pairwise discriminator comparisons Plain U-Net vs. pix2pix, and ResNet-9 vs. pix2pixHD held within each backbone family, making it possible to test not only the individual contributions of backbone architecture and adversarial training but also whether the two factors interact, investigated in Section 2.5. The U-Net pair shares an identical generator and so is precisely matched; the ResNet pair is independently implemented and so is approximately matched as shown in the experiment in Section 4.3. The scope is limited to single-story, two-dimensional floor plans under single-destination travel scenarios, generated and evaluated entirely within a synthetic dataset.
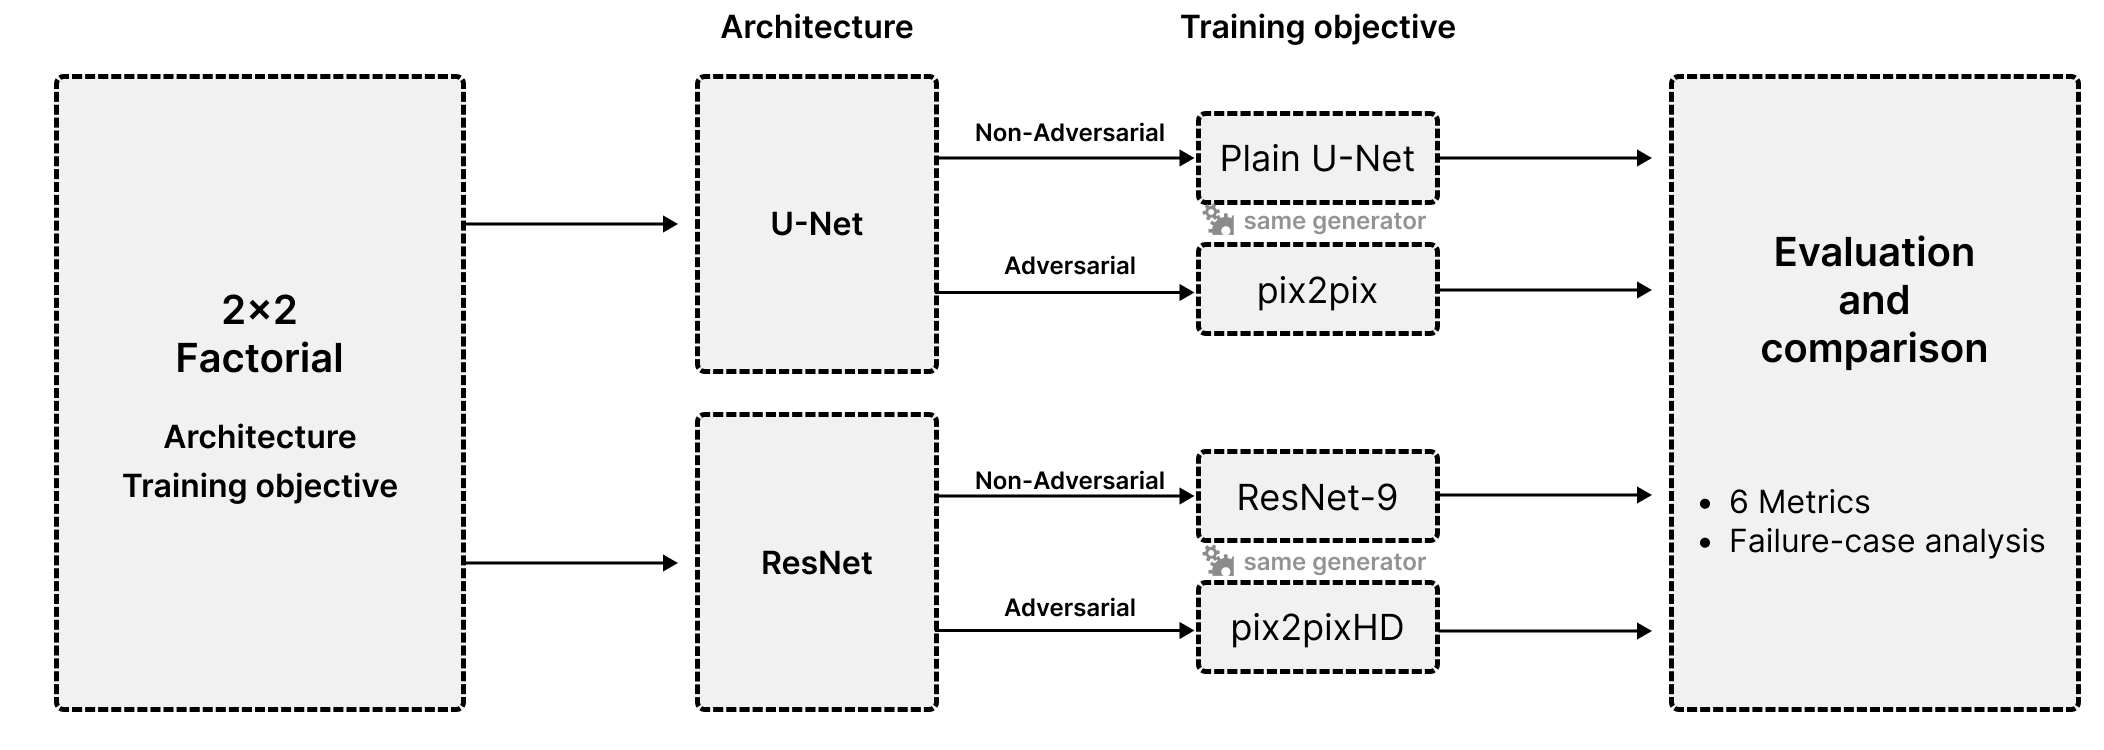
| Backbone | Non-adversarial | Adversarial |
|---|---|---|
| U-Net (identical generator) | Plain U-Net | pix2pix |
| ResNet-based (independent implementations) | ResNet-9 | pix2pixHD |
Table 1. factorial design: four model configurations by backbone architecture and training objective.
Synthetic Dataset Generation
Training data were generated synthetically using HouseGAN [7], producing 610 floor-plan layouts across six size categories. As shown in Table 2 providing diversity in room configuration, circulation path, and exit placement while keeping dataset size moderate to limit overfitting to generated-layout regularities.
| Condition | Rooms | Count |
|---|---|---|
| 1 | Medium (5–8) | 110 |
| 2 | Medium – large room (5–8) | 100 |
| 3 | Large (8–15) | 100 |
| 4 | Large – large room (8–15) | 100 |
| 5 | XL (15–20) | 100 |
| 6 | XXL (20–30) | 100 |
Table 2. Floor plan categories and dataset distribution.
Pedestrian routes were derived by abstracting each layout’s walkable area into a room-connectivity bubble diagram --- each room a node, each doorway an edge --- and selecting the longest path through this graph as the travel scenario, to capture the widest variety of spatial transitions each layout affords. Of 1,400 candidate routes generated, 74 were excluded due to agents becoming stuck during simulation, leaving 1,326 valid routes. From Fig. 2, Travel distances are right-skewed with mean, median, SD, and range of 51.25 m, 42.97 m, 30.40 m, 7.90—223.61 m, respectively. Also 9.3% of routes exceeding 100 m and 1.0% exceeding 150 m; this imbalance was retained rather than corrected, since it reflects the genuine distribution of the underlying layout population.
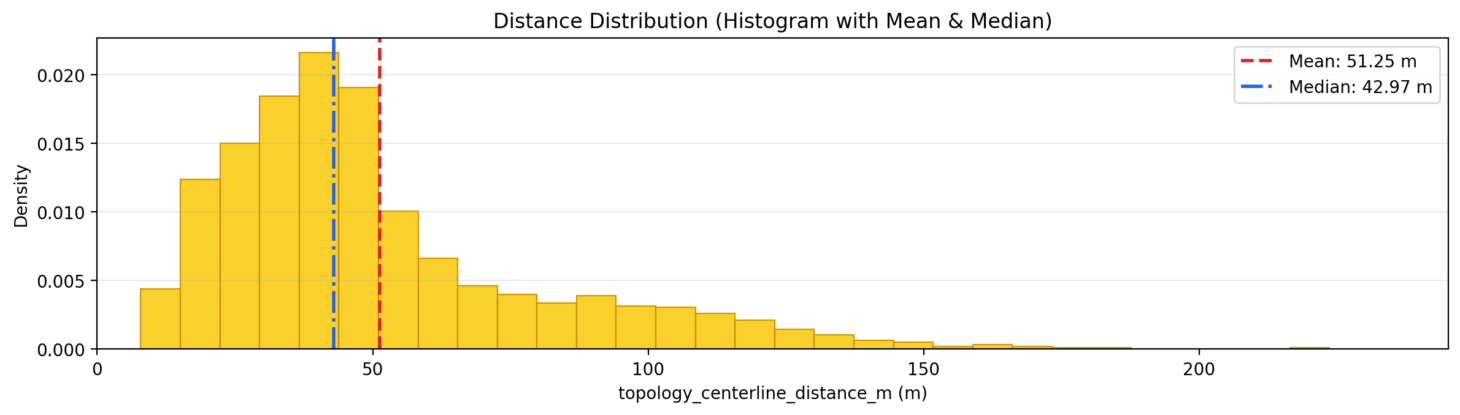
Simulation reference configuration
Reference ground truth density fields were generated using JuPedSim v1.3.2 with the Social Force Model, run under default parameters without case-specific calibration, ensuring reproducibility. Maximum occupancy per scenario was set from a density of 2 persons/m of origin-room area to induce congestion; each route was simulated at three occupancy levels (, , 1 agent), yielding 3,978 scenarios. Runs where agents failed to progress, defined by cumulative displacement m within 10 minutes of processing, were excluded --- 74 of 3,978 (1.9%) --- leaving 3,904 completed scenarios.
Dataset Preparation
Each scenario was rasterized into an RGB image white indicate walkable area as red, walls as black, destination as blue, and agents as green points at origin, with agent count doubling as an implicit occupancy signal. Target density fields were computed on a m grid using Voronoi-based local density [8] via PedPy. With set to 5.0 persons/m, time-averaged is rendered as grayscale mapped to rather than a color-mapped target, which earlier testing showed introduces banding. The dataset was split at the floor-plan level to prevent geometric leakage: 2,603 training pairs (66.7%), 439 validation (11.2%), 862 test (22.1%).
Model Configurations and Ablation Design
Four configurations are grouped by generator backbone and training objective. The U-Net group shares one generator with skip connections [9]: Plain U-Net trains it without a discriminator, i.e., L1 only, while pix2pix [10] trains the same generator with a single-scale PatchGAN discriminator, using a Wasserstein GAN with gradient penalty (WGAN-GP) loss [11] for training stability; since the generator is shared, this comparison precisely isolates the discriminator’s contribution. The ResNet group uses independent ResNet-based implementations [12]: pix2pixHD [13] trains a ResNet-based generator with a multi-scale discriminator, using the same WGAN-GP loss, while ResNet-9 trains a comparably structured nine-block ResNet generator without a discriminator; since these are separate implementations sharing only a backbone family, their comparison only approximates the same contribution. Together these four configurations form the factorial of Section 2.1: comparing the two discriminator pairs tests whether adversarial training’s effect depends on backbone architecture, while comparing Plain U-Net against ResNet-9, and pix2pix against pix2pixHD, provides a matched comparison of backbone families within each training objective.
Evaluation Metrics
Pixel-level error was measured with Mean Absolute Error (MAE), Mean Squared Error (MSE), and Root Mean Squared Error (RMSE) on grayscale intensities normalized to , convertible to physical density (persons/m) via . Structural and perceptual fidelity were measured with Structural Similarity Index (SSIM) [14], Peak Signal-to-Noise Ratio (PSNR), and Learned Perceptual Image Patch Similarity (LPIPS) [15], computed via a pretrained AlexNet backbone [16]; each captures a different notion of image quality: PSNR quantifies pixel-intensity accuracy derived from MSE, sensitive to numerical error but not perceptual relevance; SSIM compares local luminance, contrast, and structure, aligning more closely with perceived structural fidelity; and LPIPS compares deep-network feature activations rather than raw pixels, correlating most closely with human perceptual judgment. Because the three can diverge for the same prediction (Section 3.1), all three are reported rather than relying on any single metric. All metrics were computed on the held-out test set for all four configurations.
Results
Ablation: Aggregate Metrics
pix2pixHD leads on most metrics, though pix2pix achieves the best LPIPS of all four configurations. Adding a discriminator improves SSIM within each backbone family, but unevenly: for U-Net versus for ResNet; precisely isolated for U-Net, only approximated for ResNet. This asymmetry suggests an interaction between backbone and training objective, though it rests on a single run and should be read as suggestive. Across backbones, ResNet-based configurations outperform U-Net-based ones under matched training objectives, with a SSIM gain with a discriminator without a discriminator, respectively.
| Model | MAE | MSE | RMSE | SSIM | PSNR | LPIPS |
|---|---|---|---|---|---|---|
| pix2pixHD | 0.0013 | 0.0001 | 0.0057 | 0.9630 | 49.25 | 0.0372 |
| ResNet-9 | 0.0015 | 0.0001 | 0.0071 | 0.9422 | 48.77 | 0.0374 |
| pix2pix | 0.0016 | 0.0001 | 0.0076 | 0.9218 | 49.08 | 0.0353 |
| Plain U-Net | 0.0020 | 0.0002 | 0.0096 | 0.8781 | 44.98 | 0.0686 |
Table 3. Quantitative comparison of the four model configurations on the test set.
Occupancy-Level Analysis
All models degrade as occupancy increases, but ResNet-based configurations degrade markedly less than U-Net-based ones, particularly at full occupancy. The backbone gap also narrows within the adversarial pair (pix2pixHD vs. pix2pix: 0.0872) relative to the non-adversarial pair (ResNet-9 vs. Plain U-Net: 0.1309), the same interaction as Table 3: the discriminator compensates most for the weaker U-Net backbone under high occupancy.
| Model | 1 agent | (full) | |
|---|---|---|---|
| pix2pixHD | 0.9965 | 0.9602 | 0.9320 |
| ResNet-9 | 0.9979 | 0.9375 | 0.8906 |
| pix2pix | 0.9978 | 0.9218 | 0.8448 |
| Plain U-Net | 0.9947 | 0.8782 | 0.7597 |
Table 4. SSIM by model and occupancy level.
Pearson correlation coefficient ; across all metrics, with the largest magnitude observed for pix2pixHD’s SSIM at . Route length showed only a negligible-to-weak correlation with prediction error across all models, suggesting that prediction degradation is more strongly associated with occupancy level than with route length within the evaluated dataset.
Failure-Case Analysis
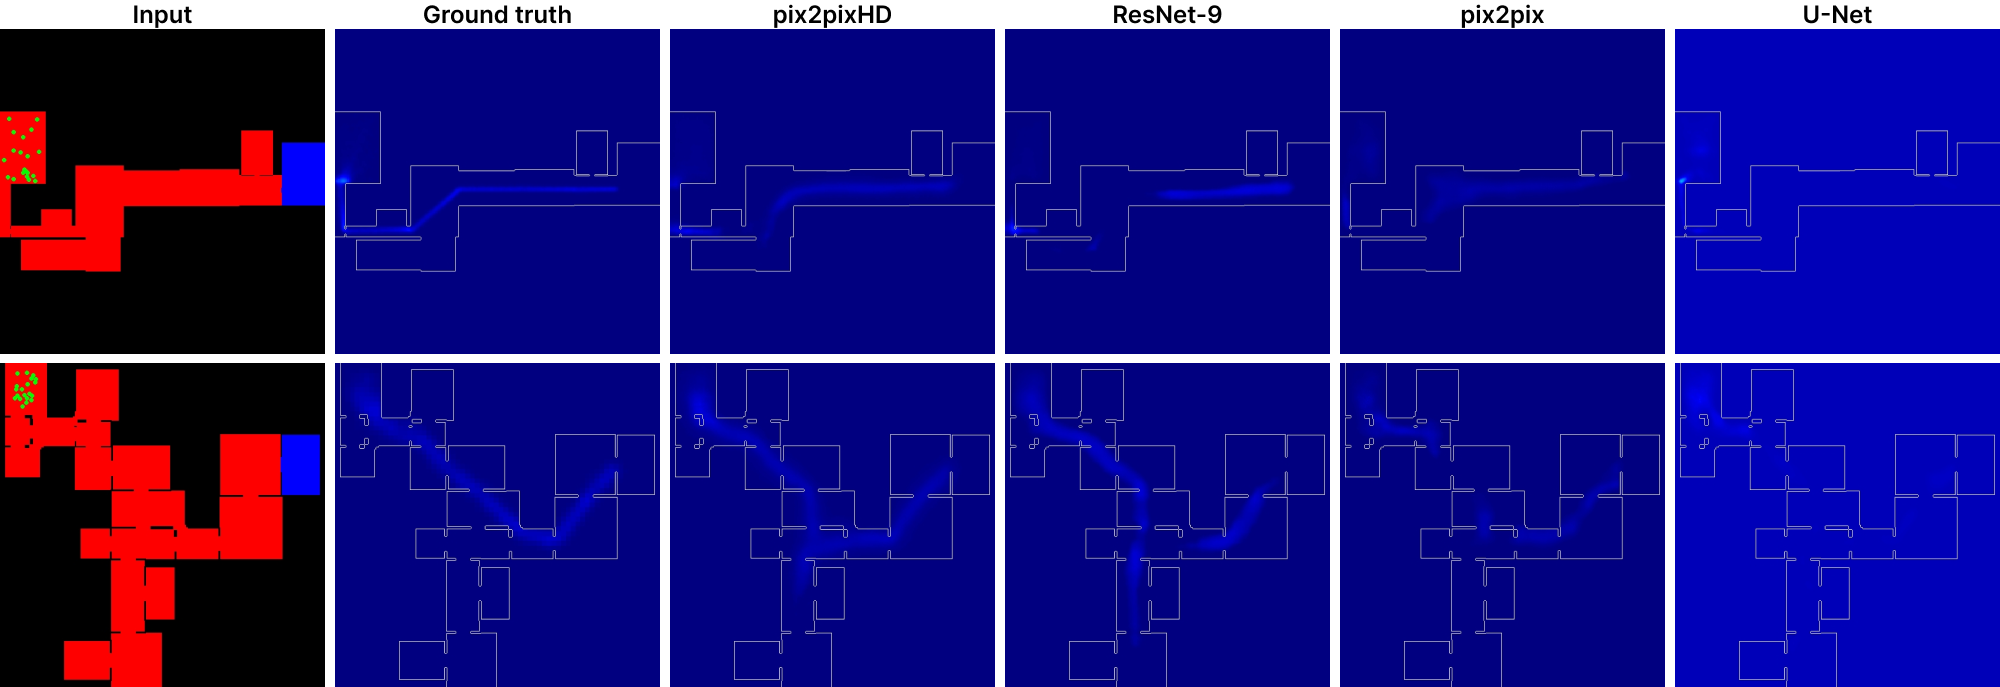
Failure cases were identified by ranking all 862 test images by mean SSIM across the four models. Best-case samples, including small origin rooms with near-zero density, trivially predicted by all models, were excluded as uninformative. A representative normal case was defined as a test image where all models fell within 0.5 SD of the overall mean SSIM. Under these typical conditions, all models approximate the ground truth with visible structural correspondence, though minor discrepancies remain. As shown in Fig. 3.
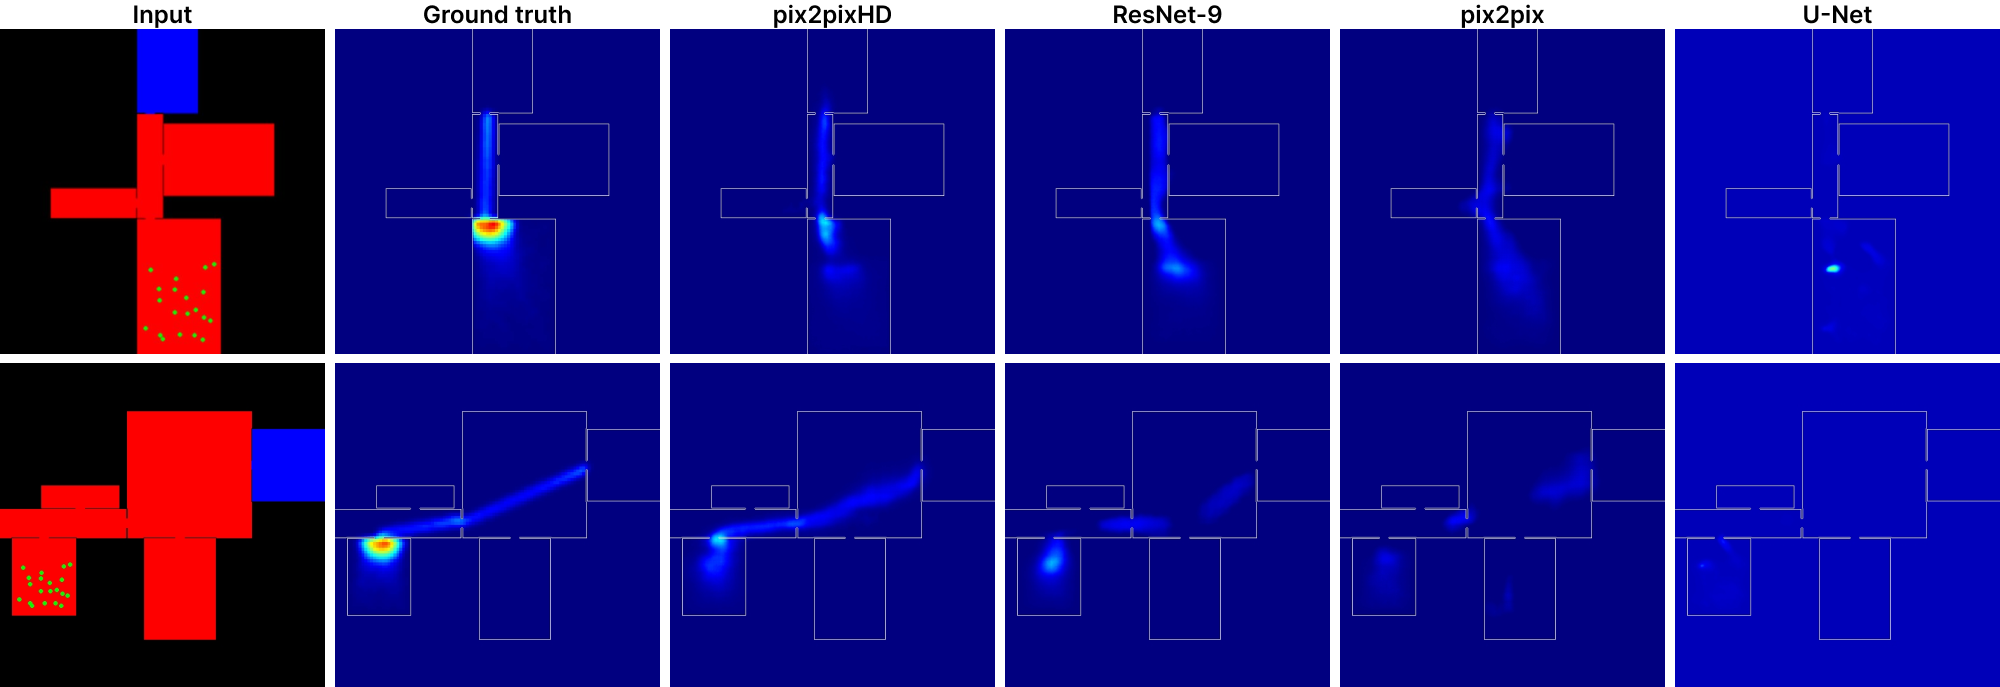
The lowest-scoring cases are consistently full-occupancy scenarios in large, room-dense layouts, where the ground truth shows a concentrated hotspot at a doorway or corridor bottleneck from agent queuing. pix2pixHD, ResNet-9, and pix2pix correctly localize these hotspots but overestimate their extent, producing more diffuse predictions than the ground truth’s sharp peak; ResNet-9 also shows discontinuity along one extended route. Plain U-Net fails more severely, predicting only a small, mislocated blob or near-uniform low density (Fig. 4). This pattern is consistent with the occupancy-level analysis in Section 3.2: the largest performance gaps occur at full occupancy, and concentrated bottlenecks under congestion remain the primary unresolved challenge for every model.
Computational Efficiency
Beyond predictive accuracy, the four surrogate models were compared against the traditional physics-based simulator (JuPedSim) on inference speed, measured on the 862-sample test set. All AI models were run on NVIDIA GPU RTX3080 while JuPedSim was run on CPU Intel Core i9-12th Gen, consistent with its traditional single-threaded execution model.
| Method / Model | Per sample (s) | Total, 862 samples (s) | Speed-up |
|---|---|---|---|
| JuPedSim (traditional simulation) | 29.57000 | 25,489.32 | |
| Plain U-Net | 0.01486 | 12.81 | |
| pix2pix | 0.01486 | 12.81 | |
| ResNet-9 | 0.06100 | 52.58 | |
| pix2pixHD | 0.06100 | 52.58 |
Table 5. Computational efficiency: traditional simulation vs. AI surrogate models.
All four surrogate models deliver a substantial inference-speed advantage over traditional simulation. Inference time tracks backbone family, not training objective: Plain U-Net/pix2pix and pix2pixHD/ResNet-9 each post identical timings within their pairs, consistent with the discriminator playing no role at inference. ResNet-based configurations are markedly slower than U-Net-based ones, since nine-block ResNet generators carry more parameters and FLOPs per forward pass, reinforcing that backbone architecture, not adversarial training, dominates computational cost as well as accuracy.
Discussion
Backbone Dominates; Discriminator Effect Varies by Backbone
Adversarial training’s contribution is not uniform across backbones, suggesting the discriminator compensates more where the backbone is weaker. Backbone architecture remains the larger driver overall: switching backbone improves accuracy more than adding a discriminator, regardless of training objective, and this gap widens under high-occupancy congestion. Practically, teams building AI-assisted density-prediction tools should prioritize backbone choice, reserving adversarial training’s tuning overhead for cases where a stronger backbone isn’t available. Because only the U-Net pair shares an identical generator, this interaction is precisely estimated for U-Net but only approximated for ResNet.
Occupancy Governs Error More Than Route Geometry
Disaggregating by occupancy level and route length shows accuracy degrading substantially under full occupancy across all models, while route length shows only a negligible-to-weak relationship with error, regardless of model. Spatially concentrated bottleneck hotspots under congestion remain the primary unresolved challenge: most severe for Plain U-Net, intermediate for pix2pix, and comparatively contained for both ResNet-based configurations (pix2pixHD, ResNet-9), consistent with the backbone-dependent interaction reported above.
Limitations and Future Work
Each configuration was trained once without repeated seeds, so reported differences, including the backbone-dependent discriminator interaction reported above, are descriptive rather than statistically validated; multiple seeds with significance testing would confirm robustness. The factorial is fully populated but matched unevenly: Plain U-Net/pix2pix share an identical generator, precisely isolating the discriminator effect, while ResNet-9/pix2pixHD are independent implementations sharing only a nine-block ResNet-style generator family, so part of their SSIM gap may reflect implementation differences rather than the discriminator alone; a matched non-adversarial ablation of pix2pixHD’s generator would test this more precisely. The discriminator architectures are also unmatched in scale: pix2pix uses a single-scale PatchGAN discriminator, while pix2pixHD uses a multi-scale discriminator, a more powerful design. If discriminator strength alone drove the SSIM gain, the ResNet pair should show an equal or larger benefit from adversarial training than the U-Net pair; instead, it shows a smaller one, so this mismatch likely makes the backbone-dependent interaction a conservative estimate rather than an inflated one. Additional caveats: the density representation clips at , leaving extreme congestion unassessed; layouts are rescaled to a fixed frame, so absolute metric scale varies across samples; and the speed comparison confounds algorithm with hardware, since JuPedSim ran on CPU and the AI surrogates on GPU. Most importantly, this study trains and evaluates only on synthetic HouseGAN floor plans; whether the backbone advantage holds on real, professionally designed buildings remains untested.
Conclusion
This study evaluated a four-configuration ablation for AI-based pedestrian density heatmap prediction, spanning a factorial (backbone training objective). Backbone architecture appears to be the stronger determinant of prediction accuracy: switching backbone improves SSIM more than adding a discriminator regardless of training objective, and this gap widens under high occupancy. Adversarial training’s benefit is backbone-dependent, larger for U-Net than ResNet, though this rests on a single run per configuration and should be read as suggestive rather than confirmed; a more precisely matched ResNet-side ablation would help confirm whether the discriminator compensates most when a strong backbone is unavailable. Prediction degradation is more strongly associated with occupancy level than with route length within the evaluated dataset. These results suggest AI surrogate tool developers should prioritize backbone architecture choice, and motivate testing whether these findings generalize to real, professionally designed buildings.
Acknowledgements
The authors acknowledge the use of AI for language editing and drafting assistance during manuscript preparation.
References
- Dirk Helbing; Péter Molnár (1995). Social force model for pedestrian dynamics. Phys. Rev. E, 51(5), pp. 4282–4286. DOI: 10.1103/PhysRevE.51.4282
- Patrick Berggold; Ana Čukarska; Stavros Nousias; Felix Dietrich; André Borrmann (2026). Machine learning in pedestrian and evacuation dynamics for the built environment: A systematic literature review. Safety Science, 198, pp. 107143. DOI: 10.1016/j.ssci.2026.107143
- Patrick Berggold; Stavros Nousias; Rohit K. Dubey; André Borrmann (2023). Towards predicting Pedestrian Evacuation Time and Density from Floorplans using a Vision Transformer. arXiv:2306.15318. arXiv:2306.15318
- Hanieh Nourkojouri; Arman Nikkhah Dehnavi; Sheida Bahadori; Mohammad Tahsildoost (2023). Early design stage evaluation of architectural factors in fire emergency evacuation of the buildings using Pix2Pix and explainable XGBoost model. Journal of Building Performance Simulation, 16(4), pp. 415–433. DOI: 10.1080/19401493.2022.2163422
- Jin Han; Zhe Zheng; Yi Gu; Jia-Rui Lin; Xinzheng Lu (2025). Generative model-based building evacuation simulation for safety design. Journal of Building Engineering, 116, pp. 114644. DOI: 10.1016/j.jobe.2025.114644
- Zhaoji Wu; Mingkai Li; Wenli Liu; Jack C.P. Cheng; Zhe Wang; H.L. Kwok; Cong Huang; Fangli Hou (2025). Developing surrogate models for the early-stage design of residential blocks using graph neural networks. Building Simulation, 18(3), pp. 679–698. DOI: 10.1007/s12273-025-1237-7
- Nelson Nauata; Kai-Hung Chang; Chin-Yi Cheng; Greg Mori; Yasutaka Furukawa (2020). House-GAN: Relational Generative Adversarial Networks for Graph-constrained House Layout Generation. arXiv:2003.06988. arXiv:2003.06988
- B. Steffen; Armin Seyfried (2010). Methods for measuring pedestrian density, flow, speed and direction with minimal scatter. Physica A: Statistical Mechanics and its Applications, 389(9), pp. 1902–1910. DOI: 10.1016/j.physa.2009.12.015
- Olaf Ronneberger; Philipp Fischer; Thomas Brox (2015). U-Net: Convolutional Networks for Biomedical Image Segmentation. arXiv:1505.04597. arXiv:1505.04597
- Phillip Isola; Jun-Yan Zhu; Tinghui Zhou; Alexei A. Efros (2017). Image-to-Image Translation with Conditional Adversarial Networks. 2017 IEEE Conference on Computer Vision and Pattern Recognition (CVPR), pp. 5967–5976. DOI: 10.1109/CVPR.2017.632
- Ishaan Gulrajani; Faruk Ahmed; Martin Arjovsky; Vincent Dumoulin; Aaron Courville (2017). Improved Training of Wasserstein GANs. arXiv:1704.00028. arXiv:1704.00028
- Kaiming He; Xiangyu Zhang; Shaoqing Ren; Jian Sun (2016). Deep Residual Learning for Image Recognition. 2016 IEEE Conference on Computer Vision and Pattern Recognition (CVPR), pp. 770–778. DOI: 10.1109/CVPR.2016.90
- Ting-Chun Wang; Ming-Yu Liu; Jun-Yan Zhu; Andrew Tao; Jan Kautz; Bryan Catanzaro (2018). High-Resolution Image Synthesis and Semantic Manipulation with Conditional GANs. 2018 IEEE/CVF Conference on Computer Vision and Pattern Recognition. DOI: 10.1109/CVPR.2018.00917
- Zhou Wang; Alan C. Bovik; Hamid R. Sheikh; Eero P. Simoncelli (2004). Image quality assessment: from error visibility to structural similarity. IEEE Transactions on Image Processing, 13(4), pp. 600–612. DOI: 10.1109/TIP.2003.819861
- Richard Zhang; Phillip Isola; Alexei A. Efros; Eli Shechtman; Oliver Wang (2018). The Unreasonable Effectiveness of Deep Features as a Perceptual Metric. arXiv:1801.03924. arXiv:1801.03924
- Alex Krizhevsky; Ilya Sutskever; Geoffrey E. Hinton (2012). ImageNet Classification with Deep Convolutional Neural Networks. Advances in Neural Information Processing Systems 25 (NIPS 2012), 25.